

Analytics
Run pnpm exec blogwright plugin add analytics to start. About 15 minutes after setup, page views appear in a dashboard on your own machine.
The analytics plugin reads CloudFront’s access logs, so it counts every request your distribution serves - static site, SPA or server-rendered app. Nothing runs in the visitor’s browser: no script, no cookie, no identifier.
What you get:
- A local dashboard with seven reports: views over time, daily unique visitors, top paths, referrers, countries, status codes and cache hit ratio.
- Your data in an Apache Iceberg table in your own AWS account, queryable with any Iceberg-aware tool.
- No raw IP addresses in the table. Visitors are counted with a daily salted hash.
- Bot traffic flagged, not dropped, so you can include or exclude it per query.
Set it up
Section titled “Set it up”-
Install the plugin:
Terminal window pnpm exec blogwright plugin add analytics -
Write the
analyticsconfig block. The defaults are fine - press Enter at each of the five prompts:Terminal window pnpm exec blogwright analytics init -
Create the pipeline. On a fresh account, expect up to a minute of waiting while new IAM roles propagate:
Terminal window pnpm exec blogwright analytics bootstrap -
Wait about 15 minutes. Firehose batches log records for up to 15 minutes before writing them to the table.
-
Open the dashboard:
Terminal window pnpm exec blogwright analytics dashboardIt prints a URL -
http://127.0.0.1:4317by default. Press Ctrl+C to stop it.
Every command takes an environment ([env] or --env) and defaults to production. The site must already be bootstrapped, because the plugin attaches to its CloudFront distribution.
Use the dashboard
Section titled “Use the dashboard”blogwright analytics dashboard serves the dashboard on 127.0.0.1 only. It queries the table with your local AWS credentials, so whoever runs it needs read access to the account.
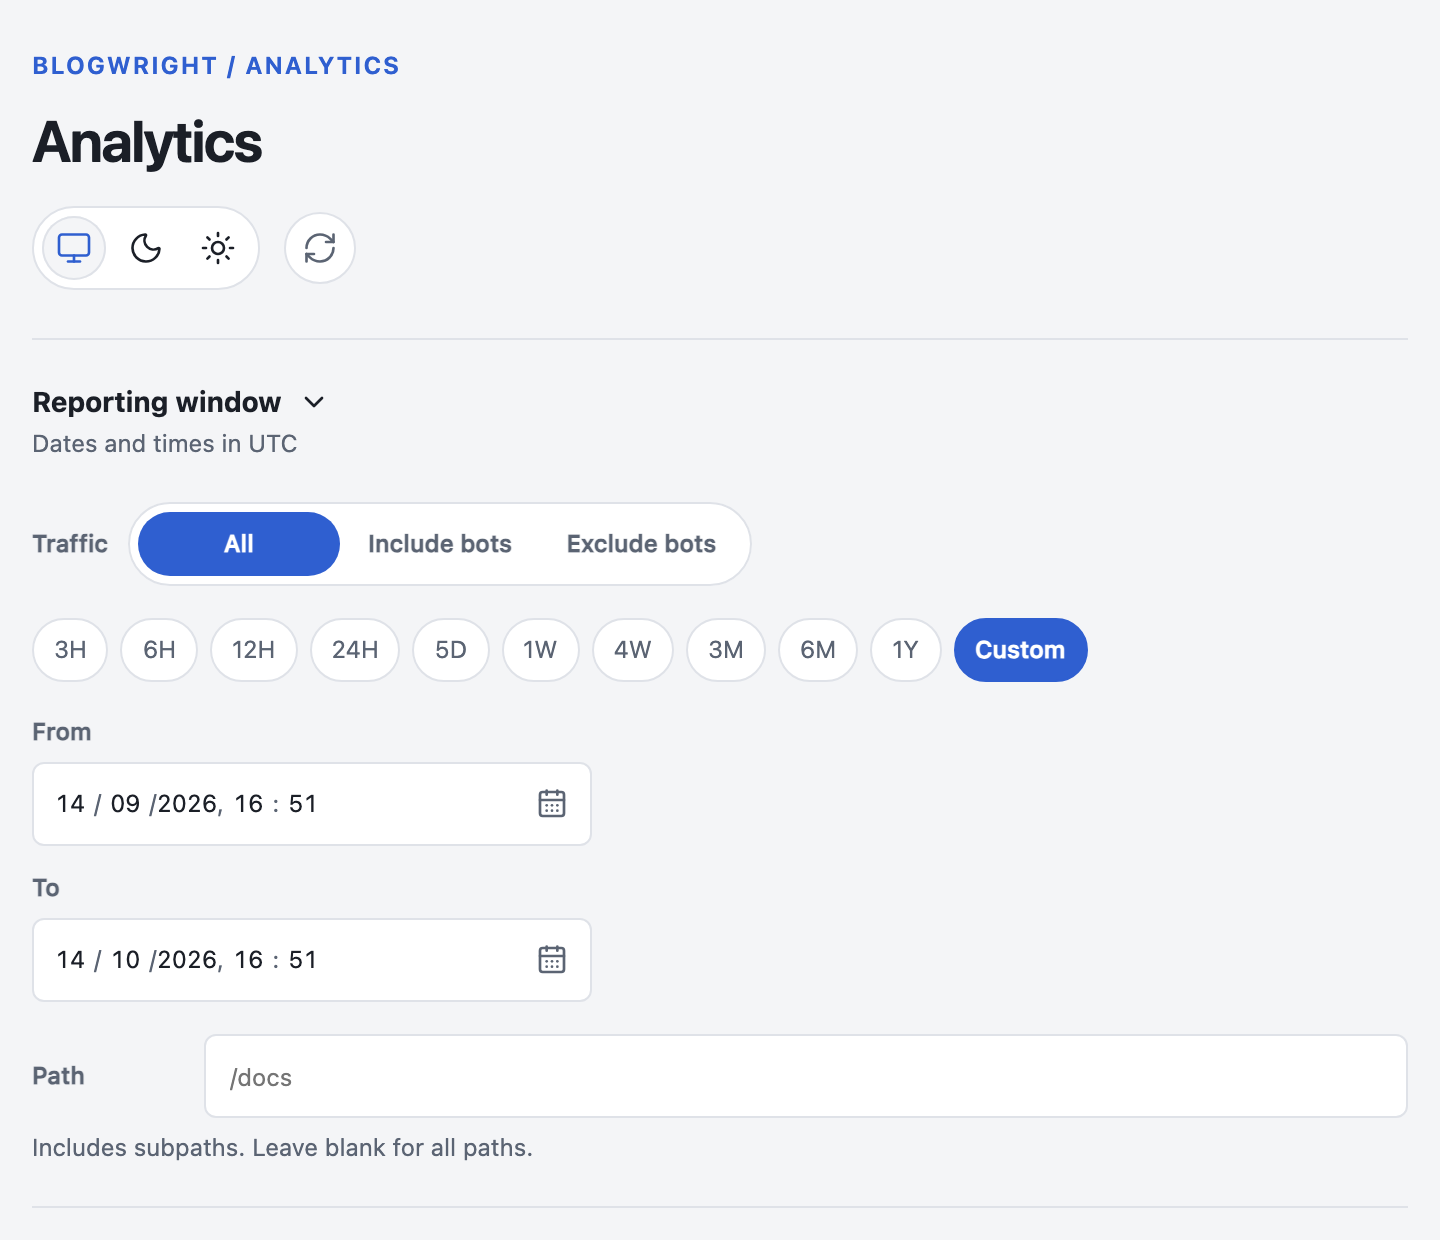
The controls:
| Control | What it does |
|---|---|
| Time window | Presets from 3 hours to 1 year, or a custom range. All times are UTC, to the minute. |
| Traffic | All shows bot and human traffic stacked. Include bots shows combined totals. Exclude bots removes flagged traffic. |
| Path | Limits every report to one path and everything under it. /writing matches /writing/... but not /writing-old. |
| Refresh | Re-runs the queries without moving the time window. |
The server answers only the dashboard’s own named queries. It never runs SQL sent to it.
The reports
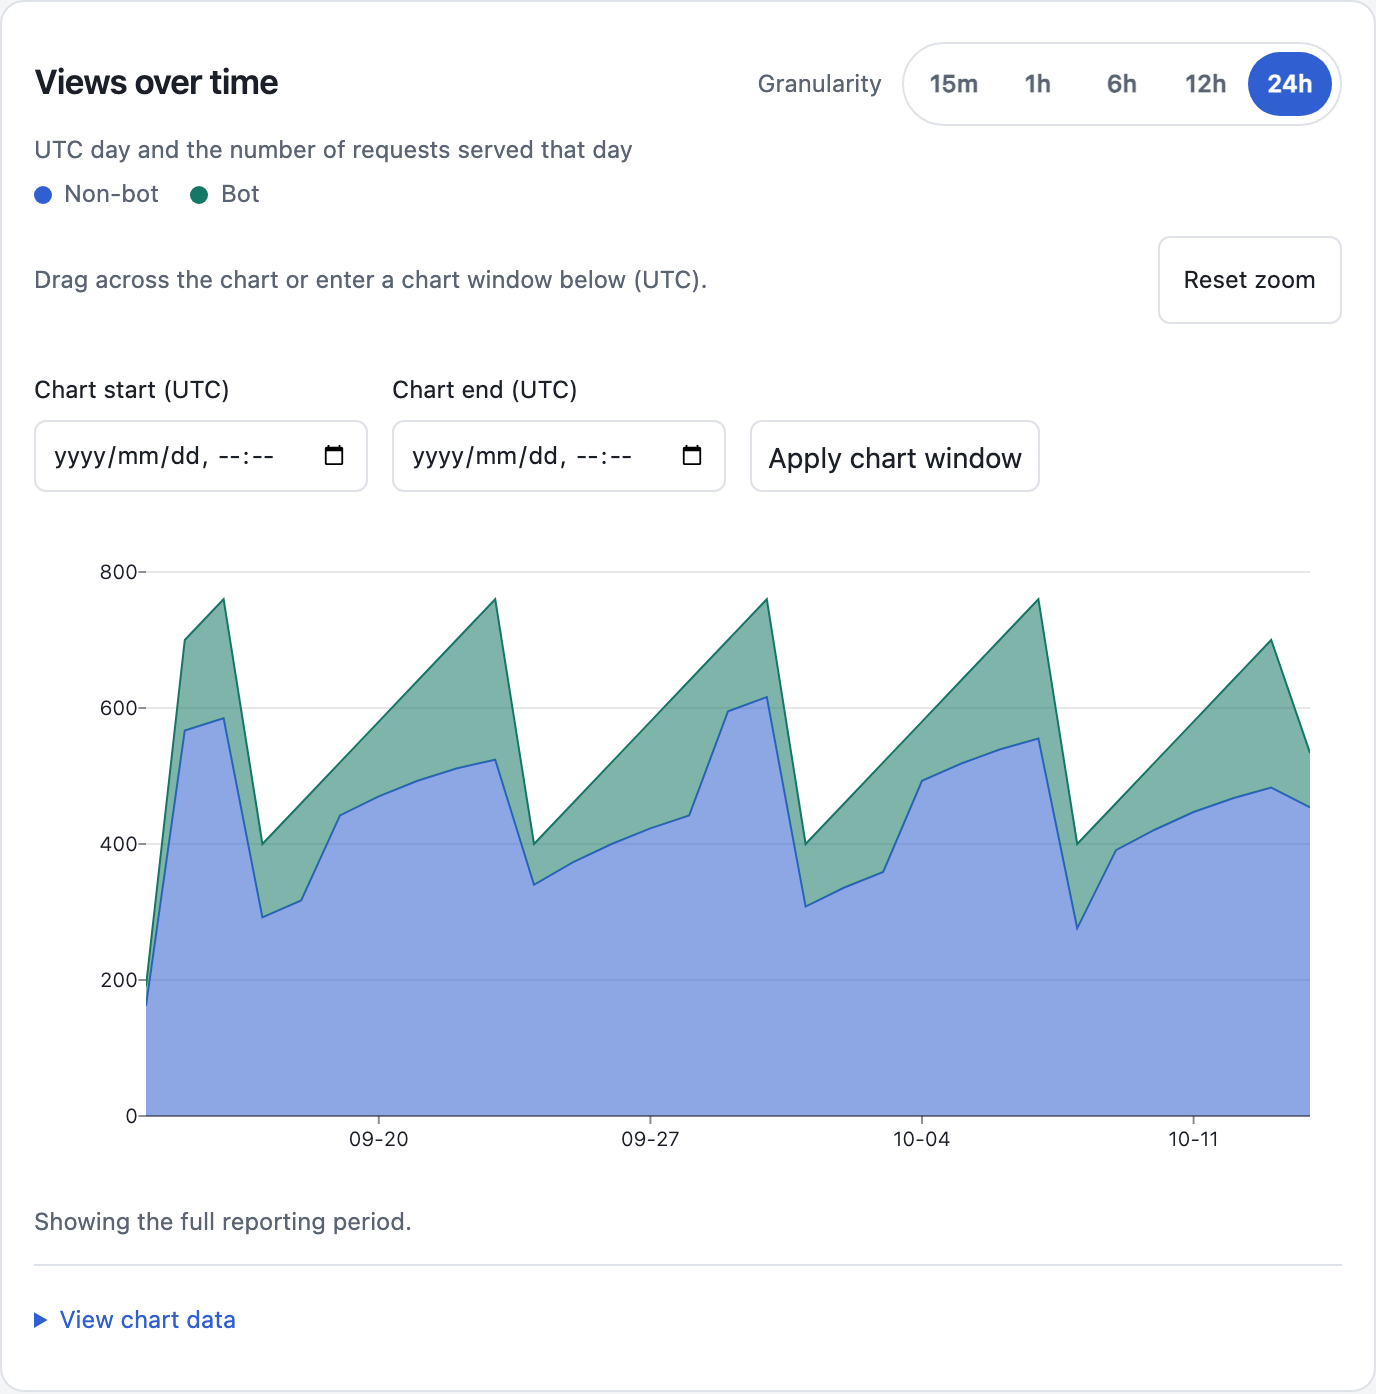
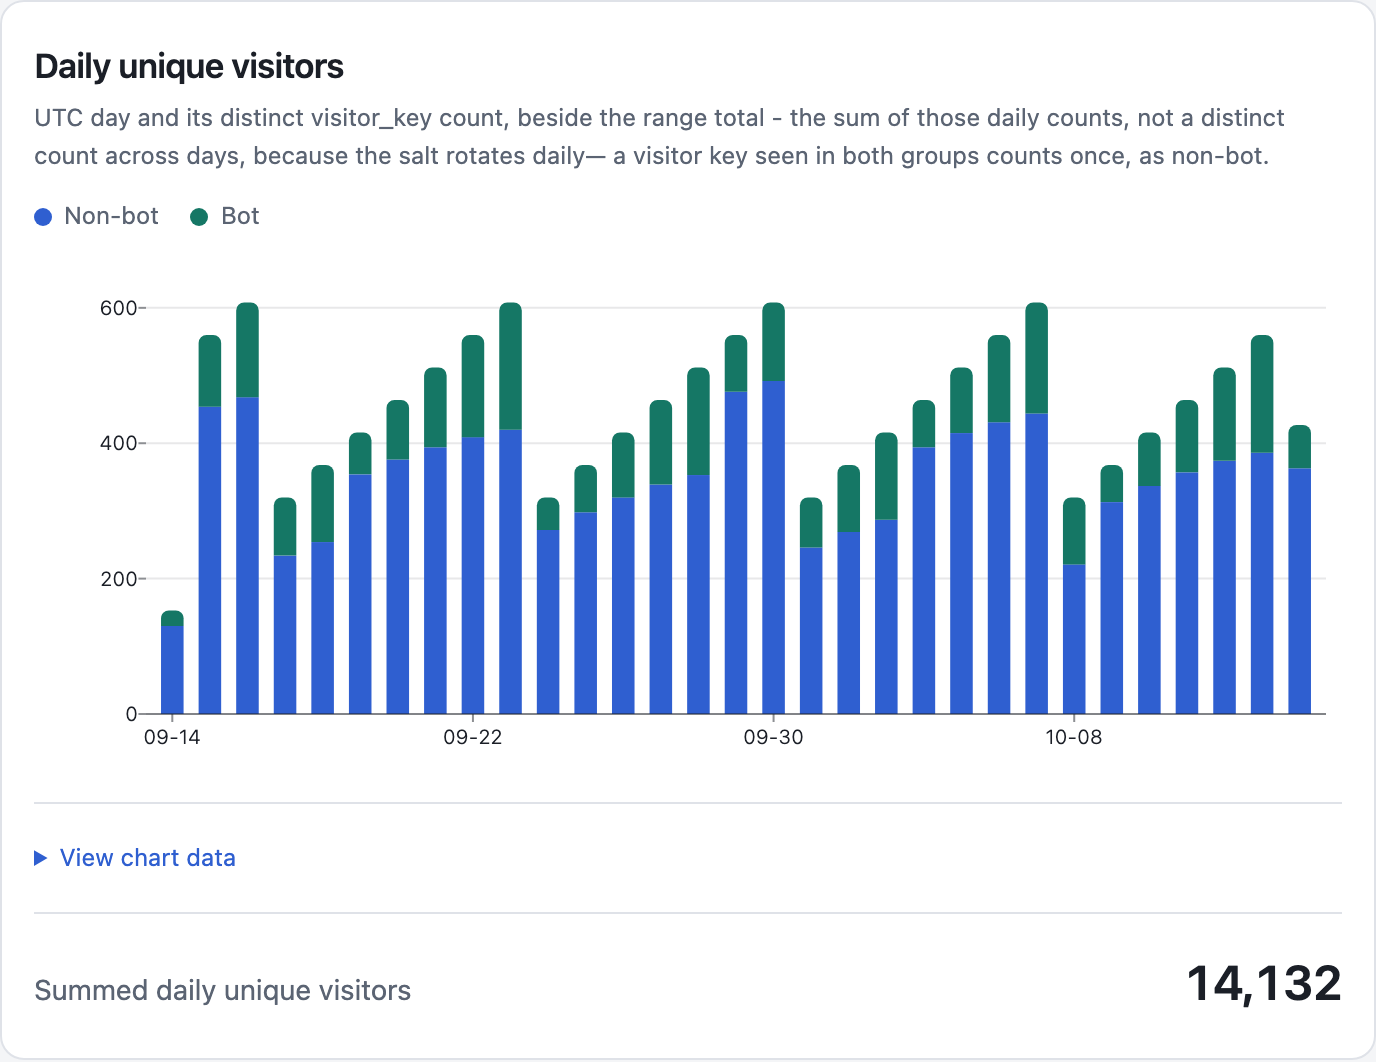
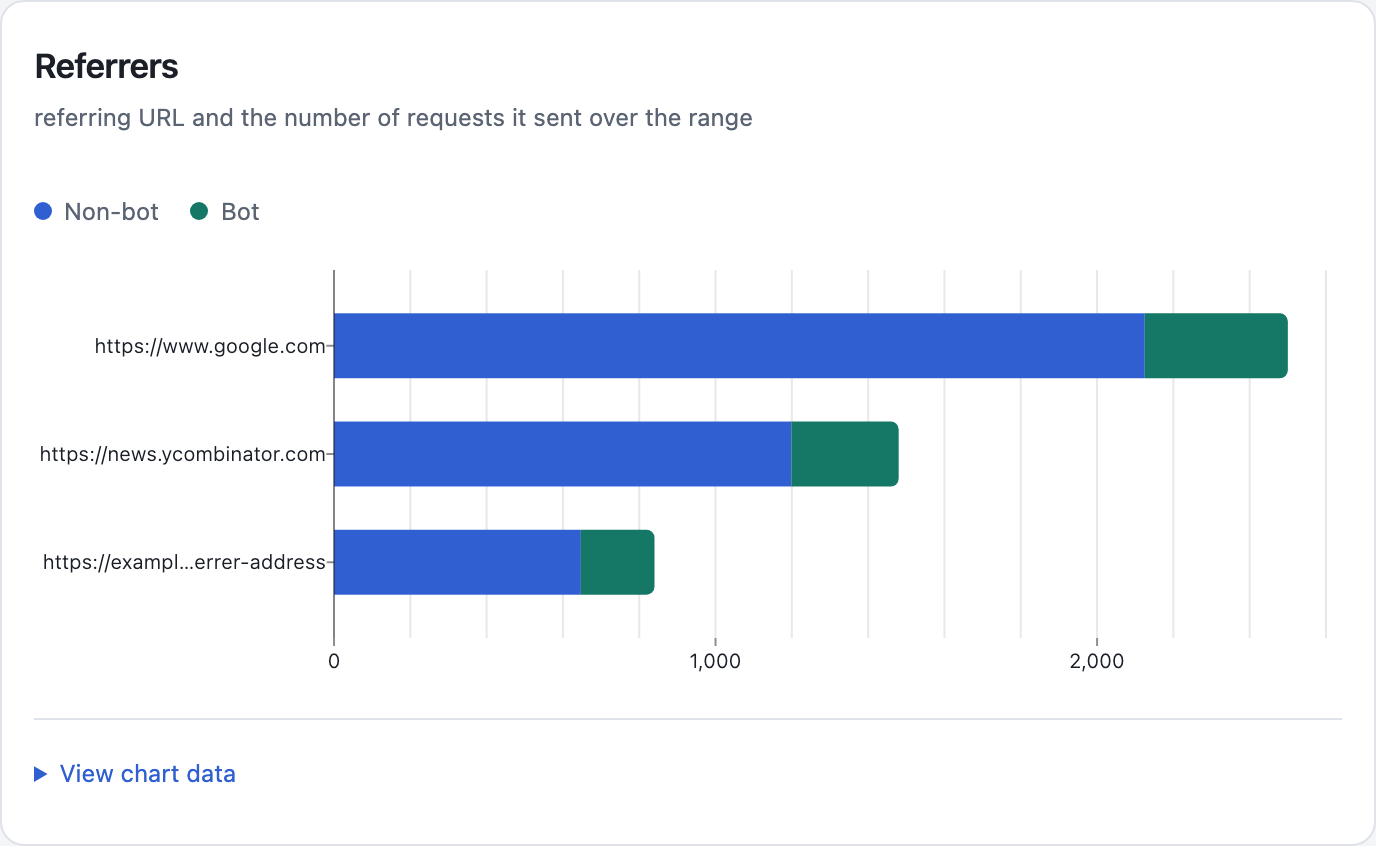
Section titled “The reports”Seven reports, each answering one question. With Traffic set to All, every chart stacks human (non-bot) and bot traffic. Open View chart data under any chart to see its numbers as a table.
The screenshots below use the dashboard’s synthetic test data.
Views over time
Section titled “Views over time”How many requests the site served, over the selected window. Pick a granularity from 15 minutes to 24 hours, and drag across the chart to zoom into a spike.
Daily unique visitors
Section titled “Daily unique visitors”Distinct visitors per UTC day, plus the total for the window. The total adds up each day’s count - see the note on unique visitors above.
Referrers
Section titled “Referrers”Which sites sent visitors to you, and how many requests each one sent.
Top paths
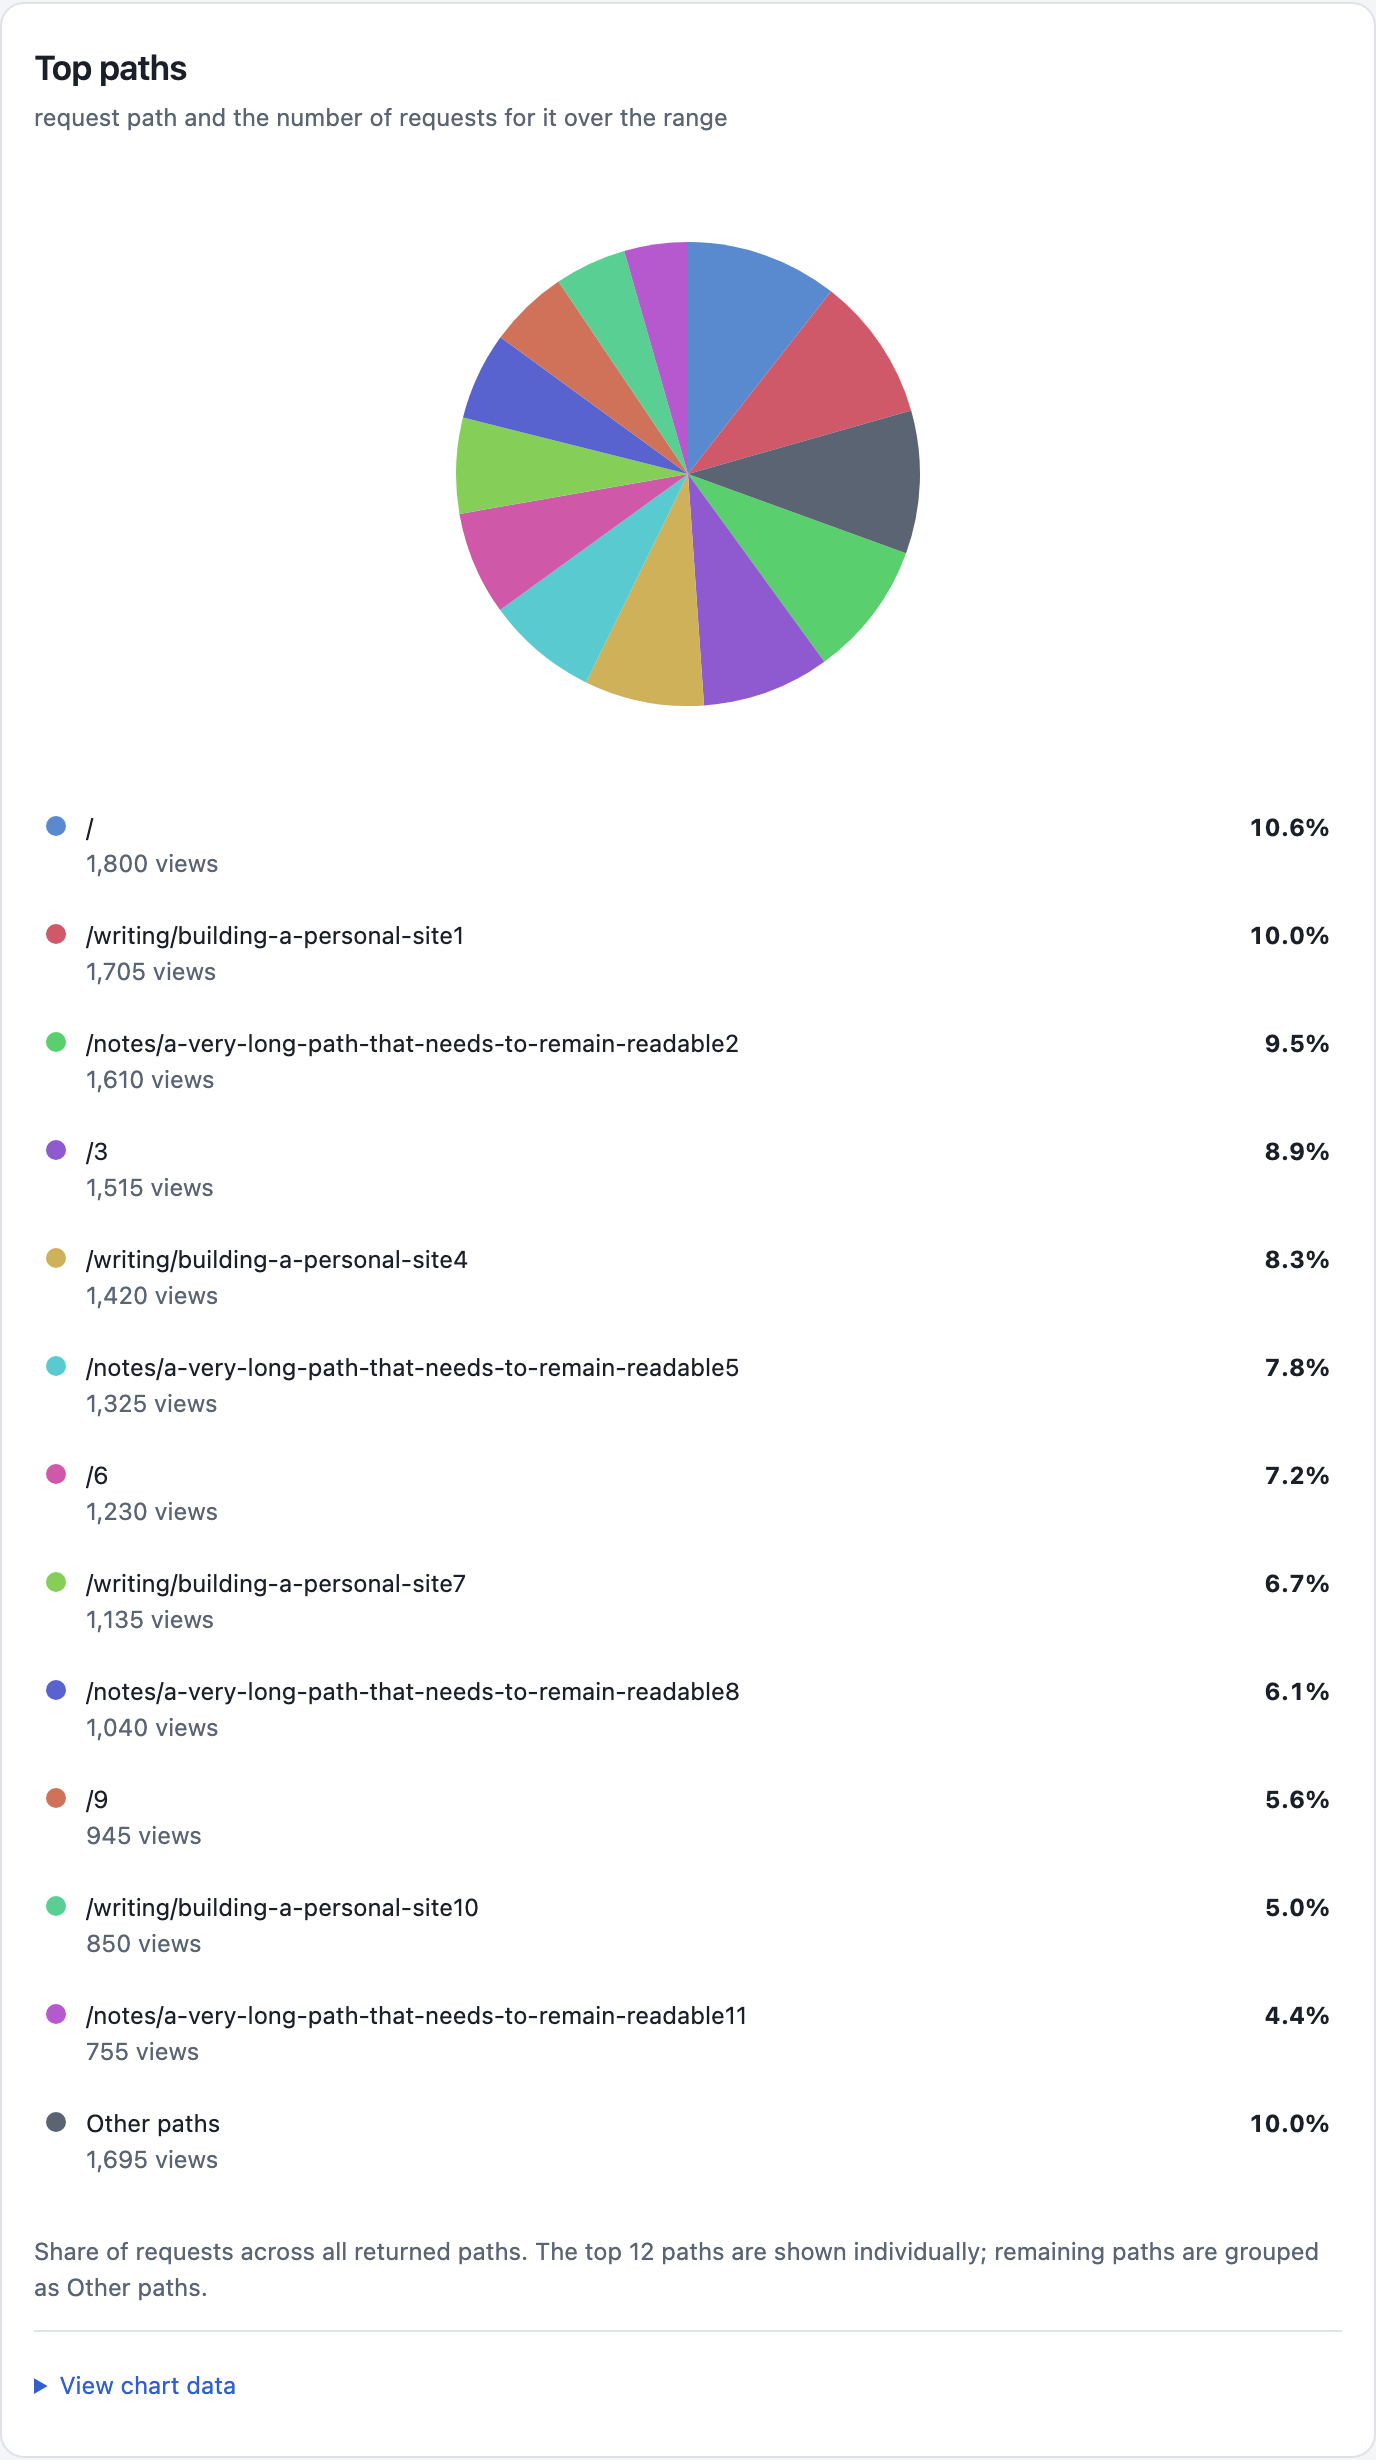
Section titled “Top paths”Which pages get the most requests. The top 12 paths appear individually with their share; the rest are grouped as Other paths.
Countries
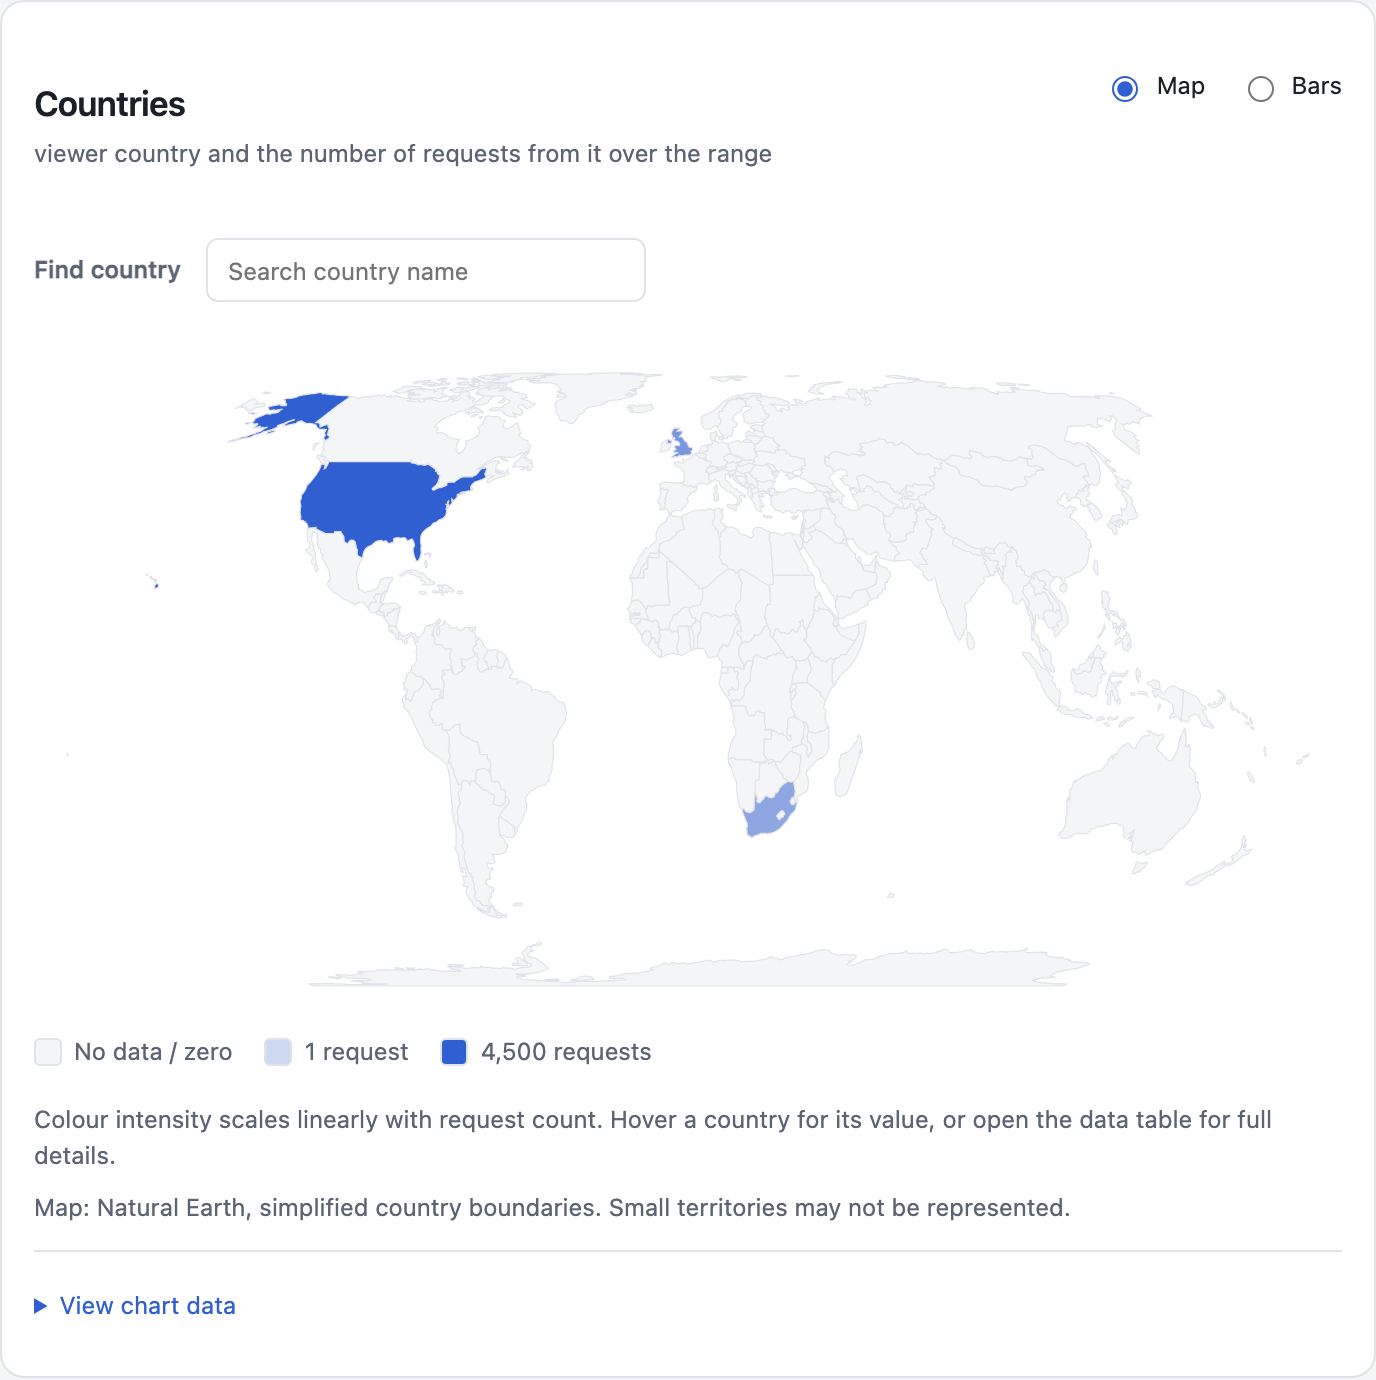
Section titled “Countries”Where requests come from, as a map or as bars. Darker countries sent more requests; search for a country to find it.
Status codes
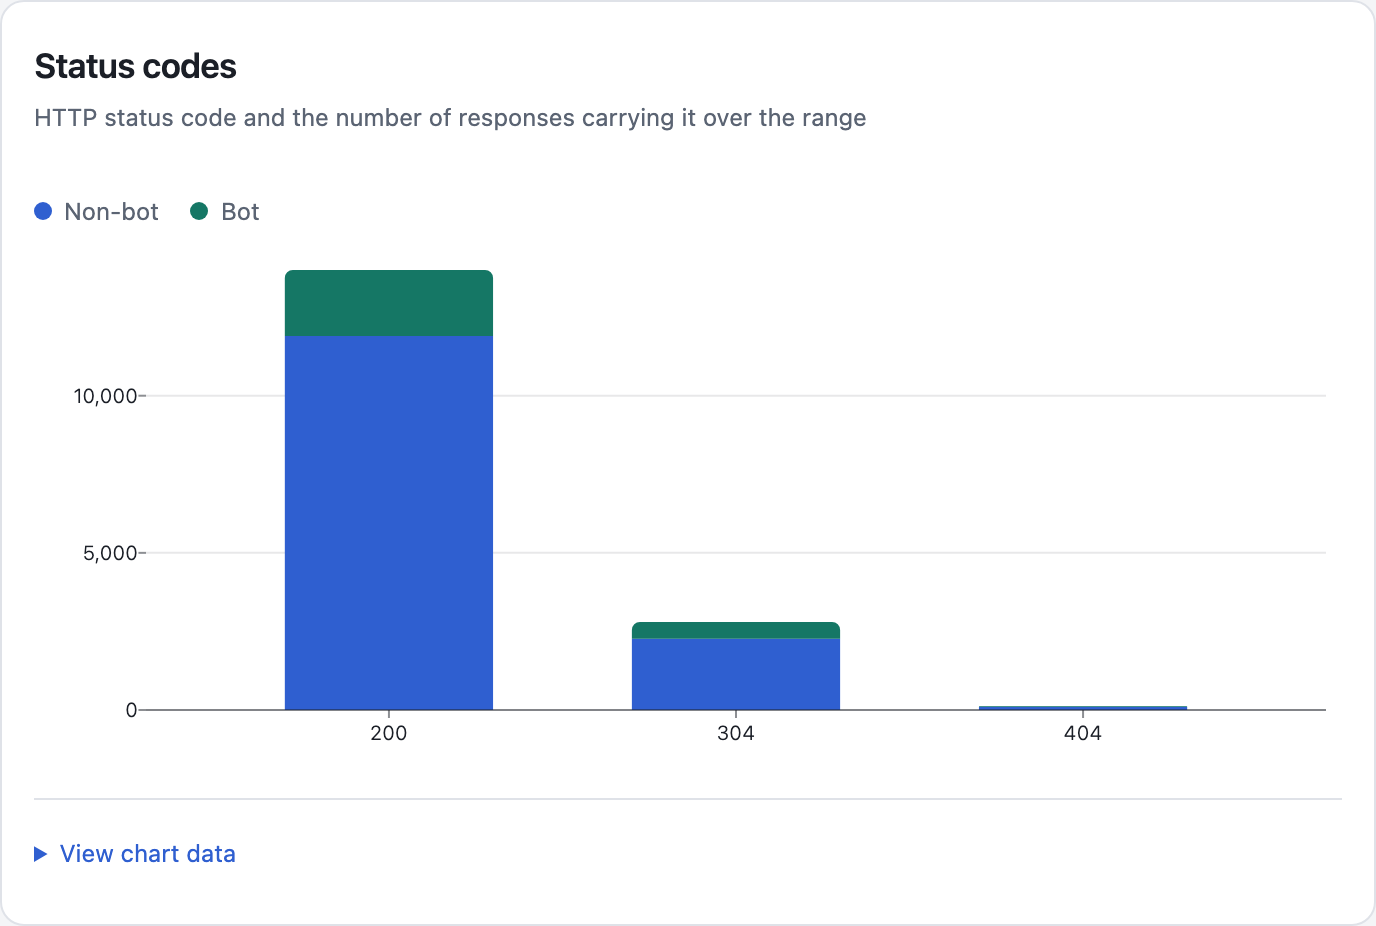
Section titled “Status codes”How many responses carried each HTTP status code - a quick way to spot a wave of 404s or 5xx errors.
Cache hit ratio
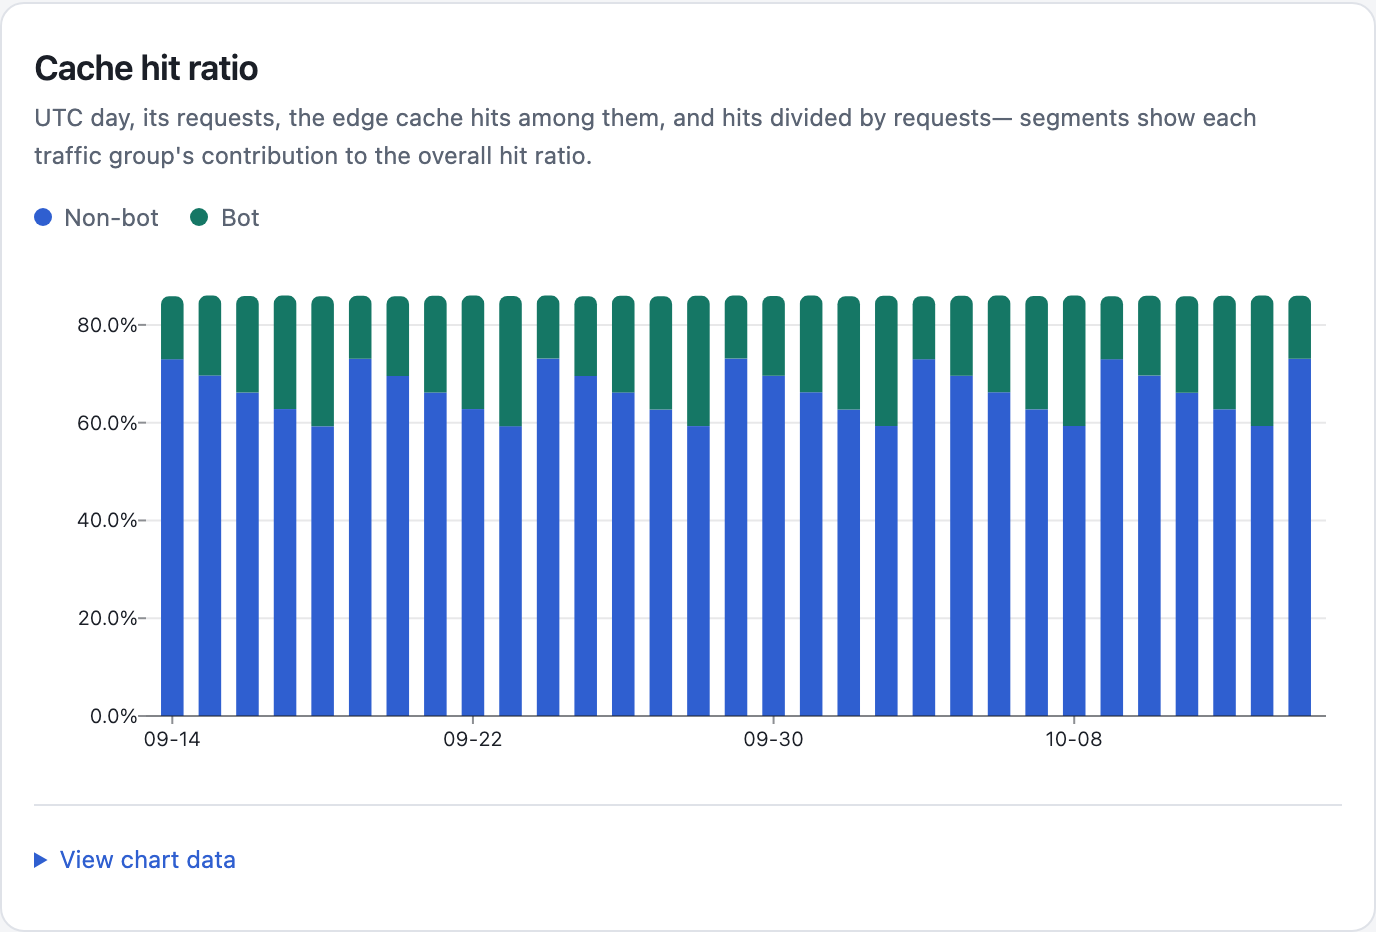
Section titled “Cache hit ratio”The share of requests CloudFront answered from its edge cache each day. Higher means faster pages and fewer origin requests.
Check it is working
Section titled “Check it is working”pnpm exec blogwright analytics statusIt reports each resource as present or missing, the Firehose stream’s delivery health, and the table’s row count. An environment that was never bootstrapped is not an error: everything shows missing and the command exits 0.
Row count still 0 after 20 minutes? Check that the site is getting traffic, then see the diagnostic logs.
Configuration
Section titled “Configuration”The analytics block in config/<env>.jsonc. Every key is optional:
{ "analytics": { "namespace": "web", "table": "page_views", "bots": "flag", "dashboard": { "port": 4317 }, },}| Key | Default | Meaning |
|---|---|---|
namespace |
web |
Iceberg namespace holding the table. Lowercase letters, digits and underscores. |
table |
page_views |
Iceberg table the page views land in. Same rule as namespace. |
bots |
flag |
flag includes bot rows in queries; filter excludes them by default. Both keep the rows. |
dashboard.port |
4317 |
Port the dashboard binds on 127.0.0.1. 1024-65535. |
tableBucket |
<env>-<siteName>-analytics |
S3 Tables bucket holding the namespace. |
saltSecretName |
<siteName>/<env>/analytics-salt |
Secrets Manager secret the daily salt comes from. |
init asks for the first four. Write tableBucket or saltSecretName by hand if you need to override them.
The block does nothing until the plugin is installed. Unknown keys are rejected when an analytics command runs.
What bootstrap creates
Section titled “What bootstrap creates”Fourteen resources, all in us-east-1 whatever your site’s region is. CloudFront only delivers logs to a Firehose stream in us-east-1, so everything the stream touches follows it.
| Stage | Resources |
|---|---|
| Log delivery | A second CloudFront log delivery beside the site’s existing CloudWatch one, a Firehose delivery stream and its IAM role |
| Transform | A Lambda function that turns log lines into rows, its IAM role, and the Secrets Manager salt secret it reads |
| Storage | An S3 Tables bucket, its namespace and the page_views Iceberg table, plus the Glue s3tablescatalog federation Firehose writes through |
| Failures | An S3 bucket for records the transform could not process |
| Diagnostics | Log groups for the Lambda and the Firehose stream |
The resources are recorded in state/<env>.analytics.json. blogwright bootstrap never creates them, and blogwright destroy refuses until blogwright analytics destroy has removed them. See Plugins overview.
Import history with backfill
Section titled “Import history with backfill”pnpm exec blogwright analytics backfillFirehose only sees requests made after its delivery existed. backfill imports the days before that, from the CloudWatch log group your site already writes (/<siteName>/<env>/cloudfront). How far back it reaches depends on retention.cloudfrontDays.
It runs once and is safe to re-run:
- It imports only whole days before the day the analytics delivery was created, so it never overlaps Firehose.
- Each day is one transaction. A day the table already holds is skipped, so a re-run inserts nothing and a crashed run resumes.
- The boundary day itself is never imported. Up to one day of history at the seam is lost - that is the accepted cost of never comparing rows.
Rows match exactly what Firehose would have written: backfill uses the same transform code and the same daily salt.
backfill refuses before calling AWS if analytics bootstrap has not run. It reports every day it inserted, every day it skipped and why, and the boundary day.
Privacy
Section titled “Privacy”- No raw IP addresses in the table. The transform uses the viewer’s IP only to compute
visitor_key, then discards it. visitor_keyis a daily salted hash of the IP, the user agent and that day’s salt. The salt is derived from a long-lived random secret, never from the date alone, so the hash cannot be brute-forced back to an IP.- Cookies and
X-Forwarded-Forare never selected, so they never leave CloudFront for this pipeline. - No cookie or identifier is written to the visitor’s browser.
Two places can still hold raw data:
- Failed records. A record the transform cannot process goes to the failures bucket in its original form, which can include the IP. The bucket has no automatic expiry, and teardown empties it.
- Your site’s CloudWatch logs. The site’s own log delivery is separate, keeps AWS’s default fields (including cookies and IPs), and follows
retention.cloudfrontDays.
Retention
Section titled “Retention”Table rows are never aged out. S3 Tables has no row-retention setting for a table you create, and the table is append-only and partitioned by day.
The two diagnostic log groups keep 365 days. retention.cloudfrontDays controls only the site’s CloudWatch copy of the logs, which also bounds how far backfill can reach.
Diagnostic logs
Section titled “Diagnostic logs”| Log group (us-east-1) | What it holds |
|---|---|
/aws/lambda/<env>-<siteName>-analytics-transform |
Per-batch counts of mapped and failed records, with fixed failure categories, and salt-read results |
/aws/kinesisfirehose/<env>-<siteName>-analytics-firehose |
Firehose delivery errors |
The transform’s diagnostics never include record contents, secret values or error details.
Tear it down
Section titled “Tear it down”pnpm exec blogwright analytics destroy <env> --yesThis deletes the environment’s pipeline, the table and the failed-record objects. Two resources are kept on purpose, and the command prints how to remove them by hand:
- The Glue
s3tablescatalogfederation. It is shared by every environment in the account and region, so removing it for staging would break production. - The salt secret. Replacing it would make surviving rows and future backfills disagree.
To uninstall the plugin afterwards, run pnpm exec blogwright plugin remove analytics --yes. See Remove a plugin.
Related pages
Section titled “Related pages”- Plugins overview - how plugins install, store state and tear down
- CLI reference - plugin commands and flags
- Configuration reference - the
analyticsblock’s validation rules